Monitoring for the Puget Sound Data Ring is provided primarily by Cacti and Smokeping from the monitoring.hamwan.org server.
Cacti
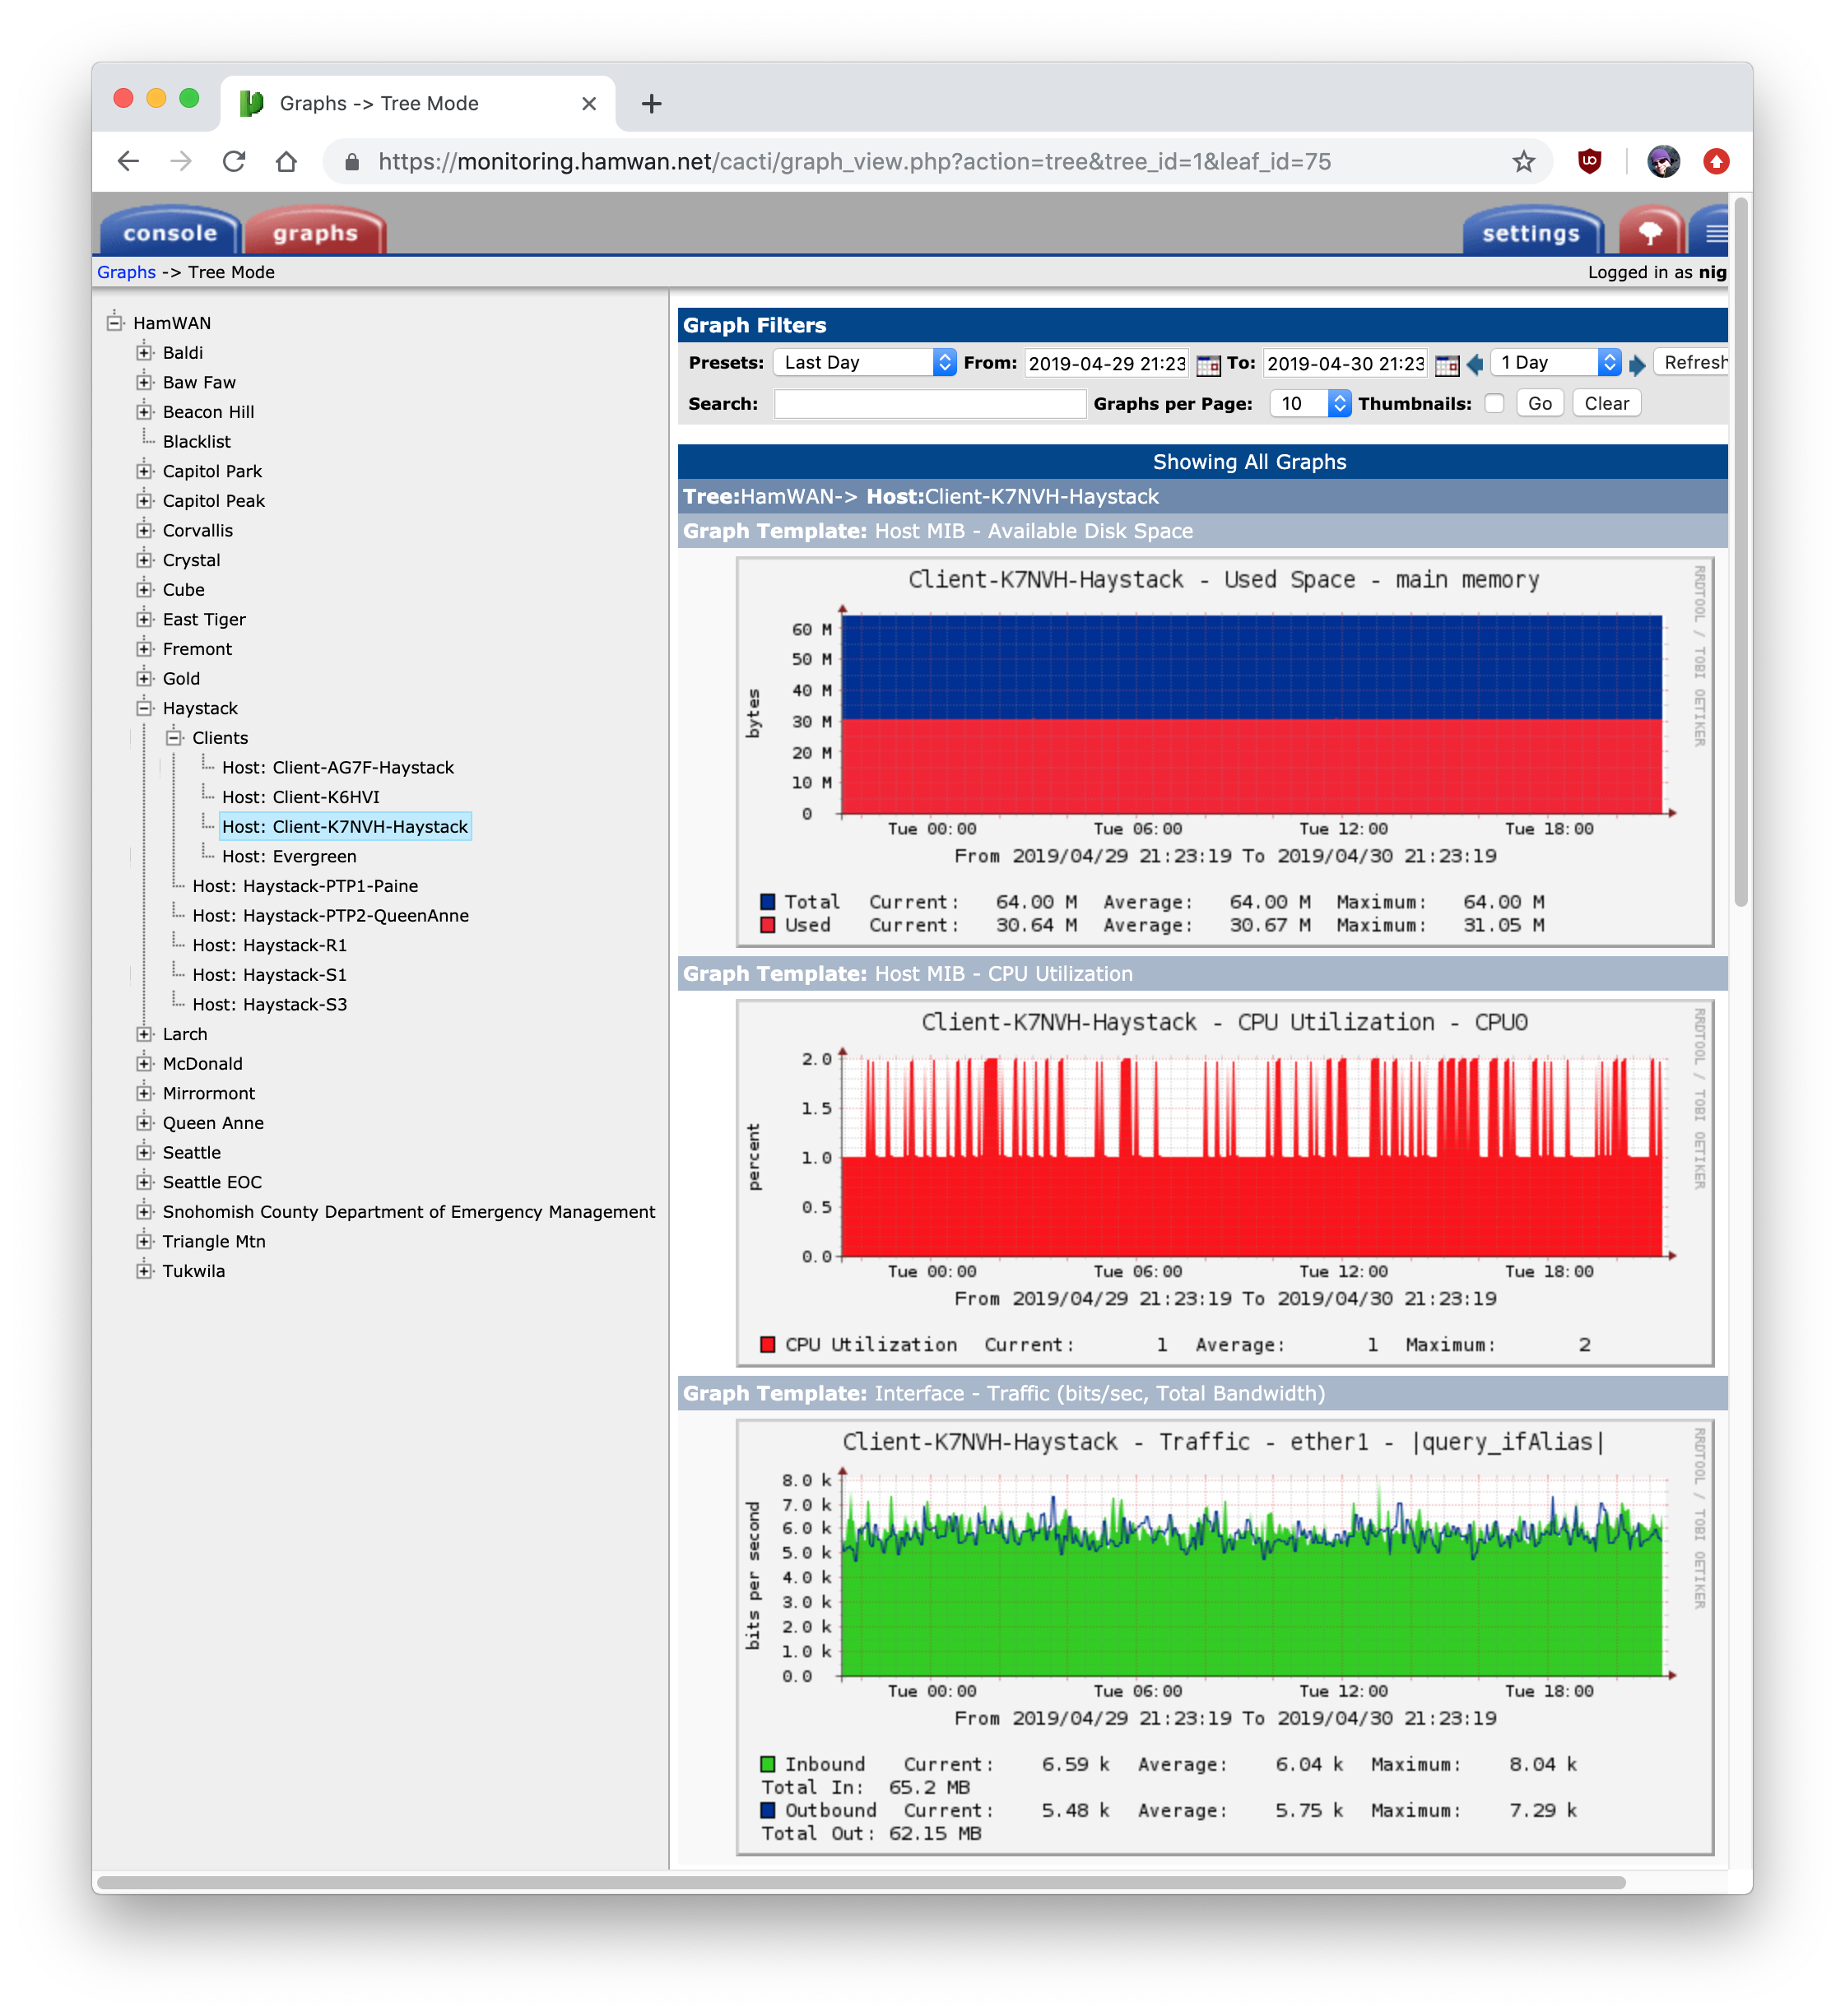
Cacti provides SNMP polling of the network devices and historical graphs. Primarily useful for looking at network throughput and wireless monitoring.
The hamwan.org homepage map uses data pulled from Cacti’s RRD files, so any user or link on the map must be in place in cacti.
Cacti is available at: http://monitoring.hamwan.net/cacti/
Adding a host to Cacti
Adding hosts to Cacti is mostly templated, though, some devices require manual adjustments due to Mikrotik changing the SNMP OIDs of some values.
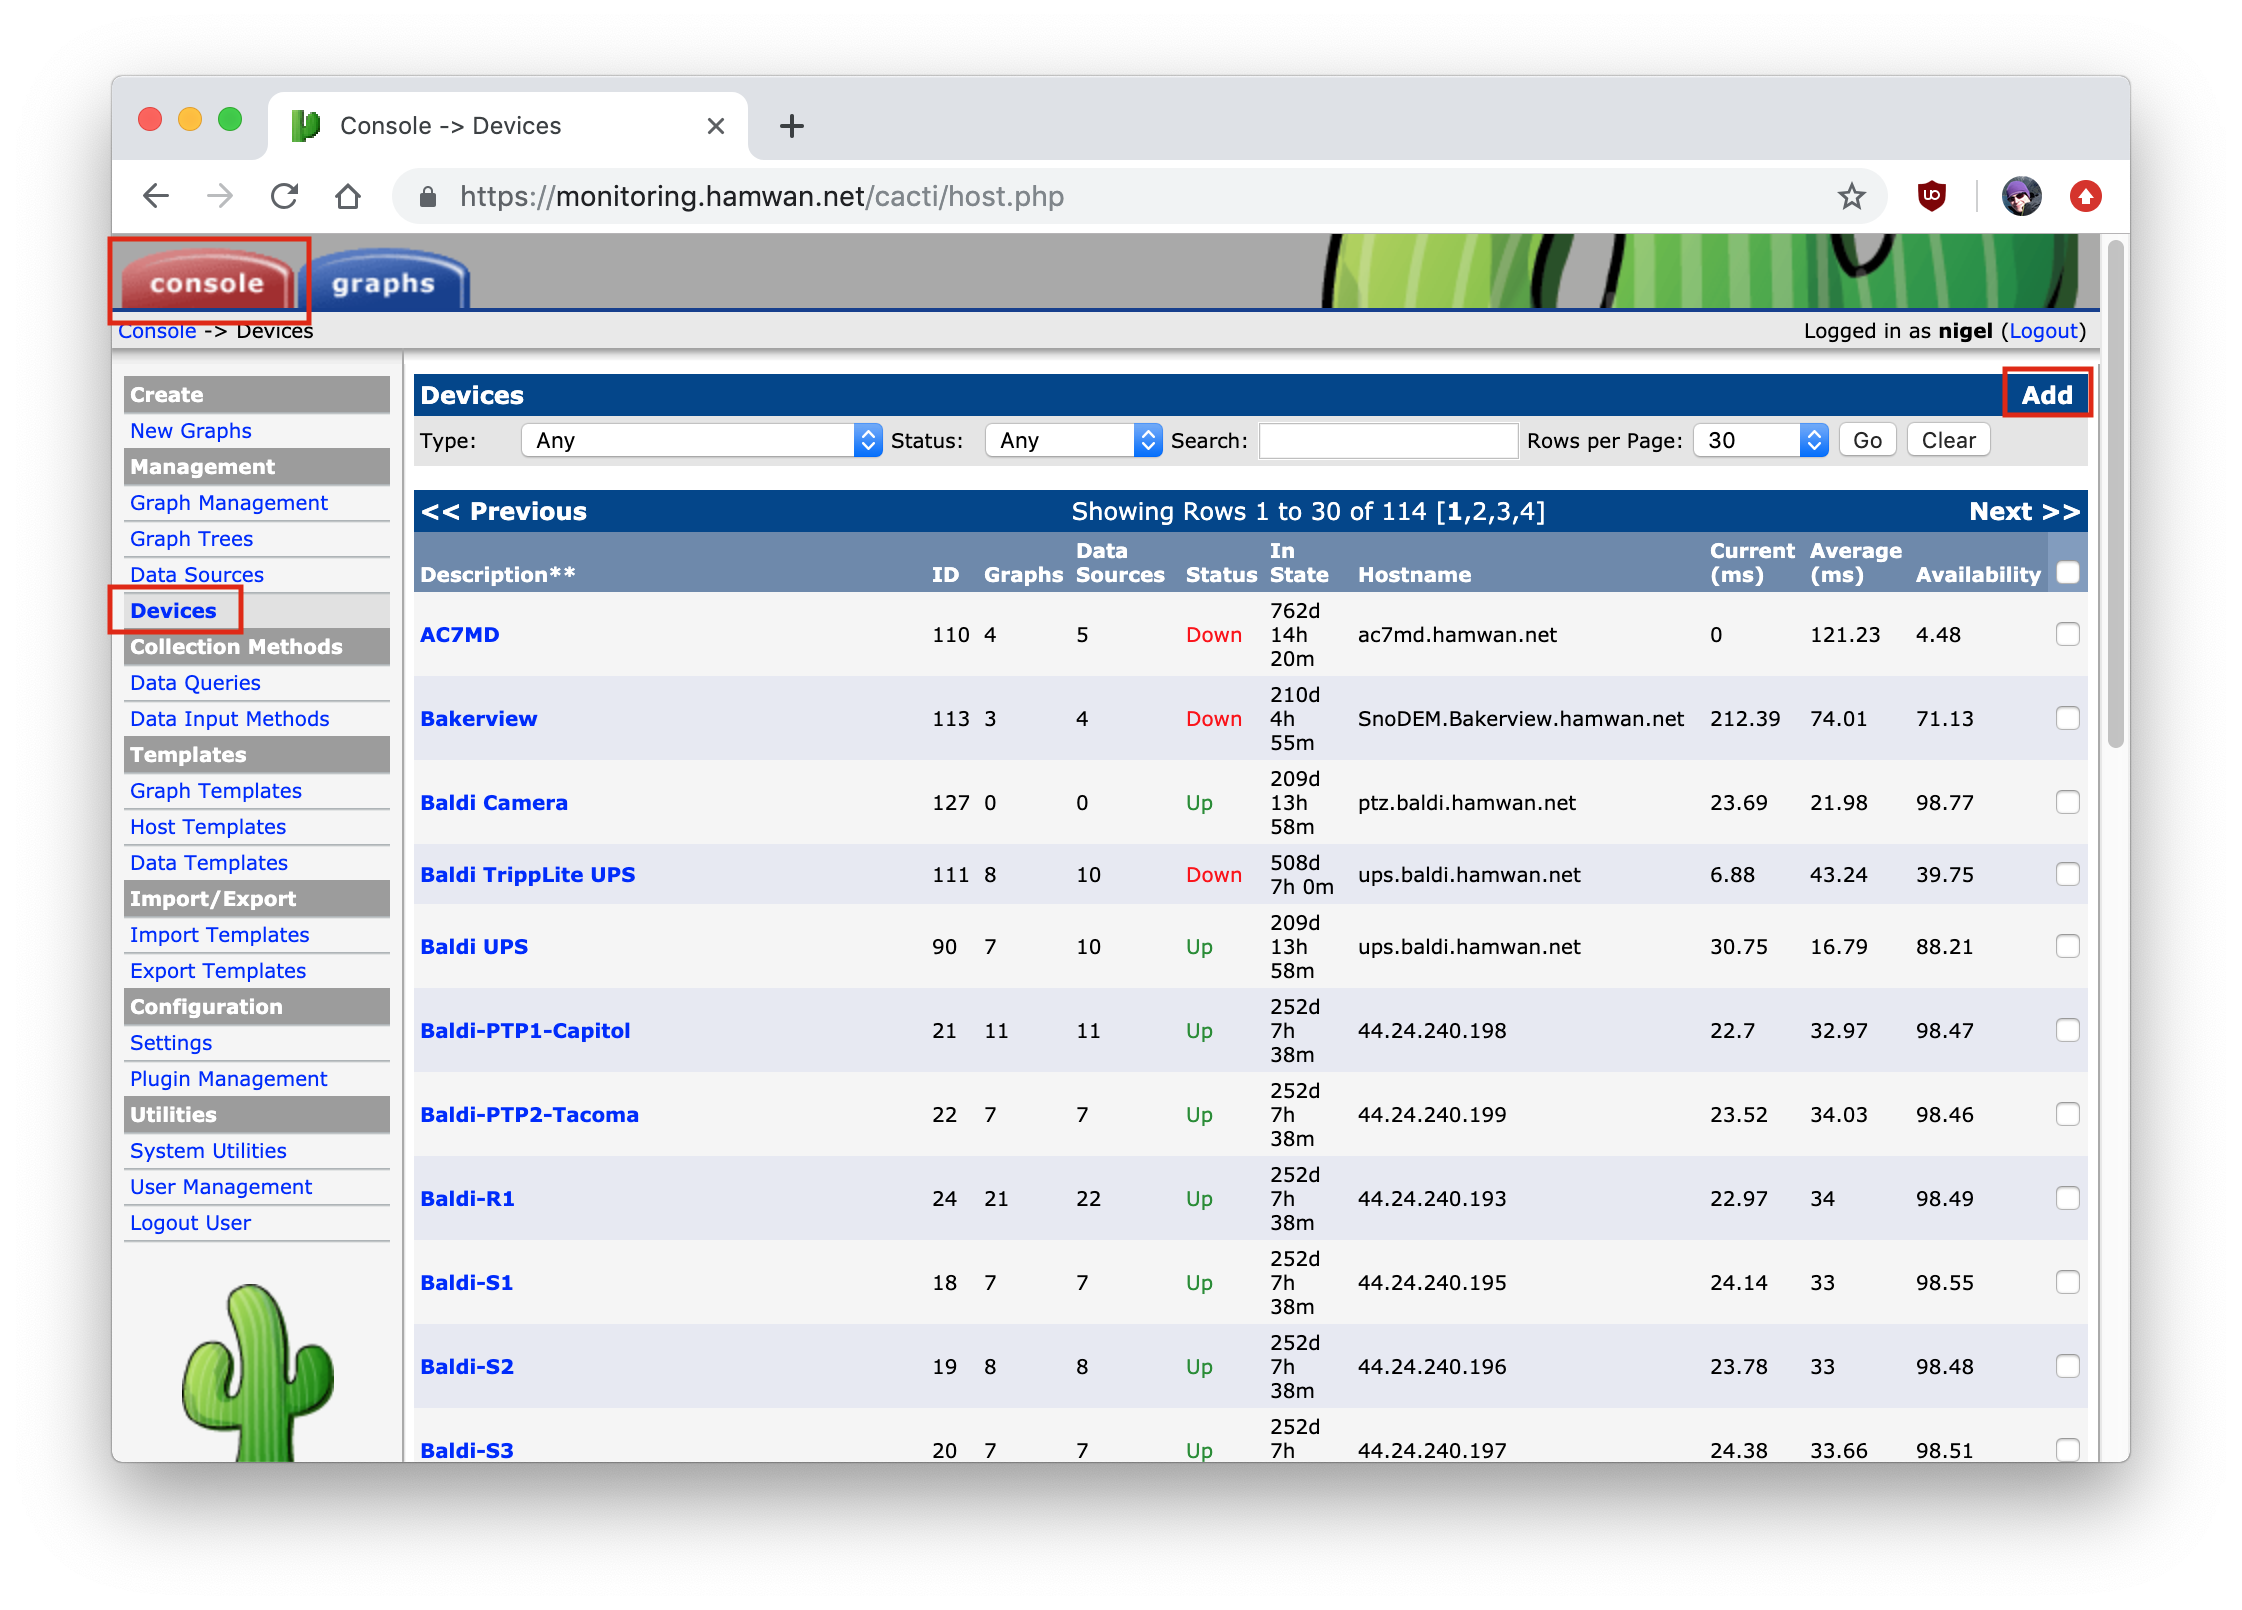
After logging into Cacti you’ll want to navigate to the Console tab and the Devices page. There you will find all the existing devices, and the “Add” option in top right.
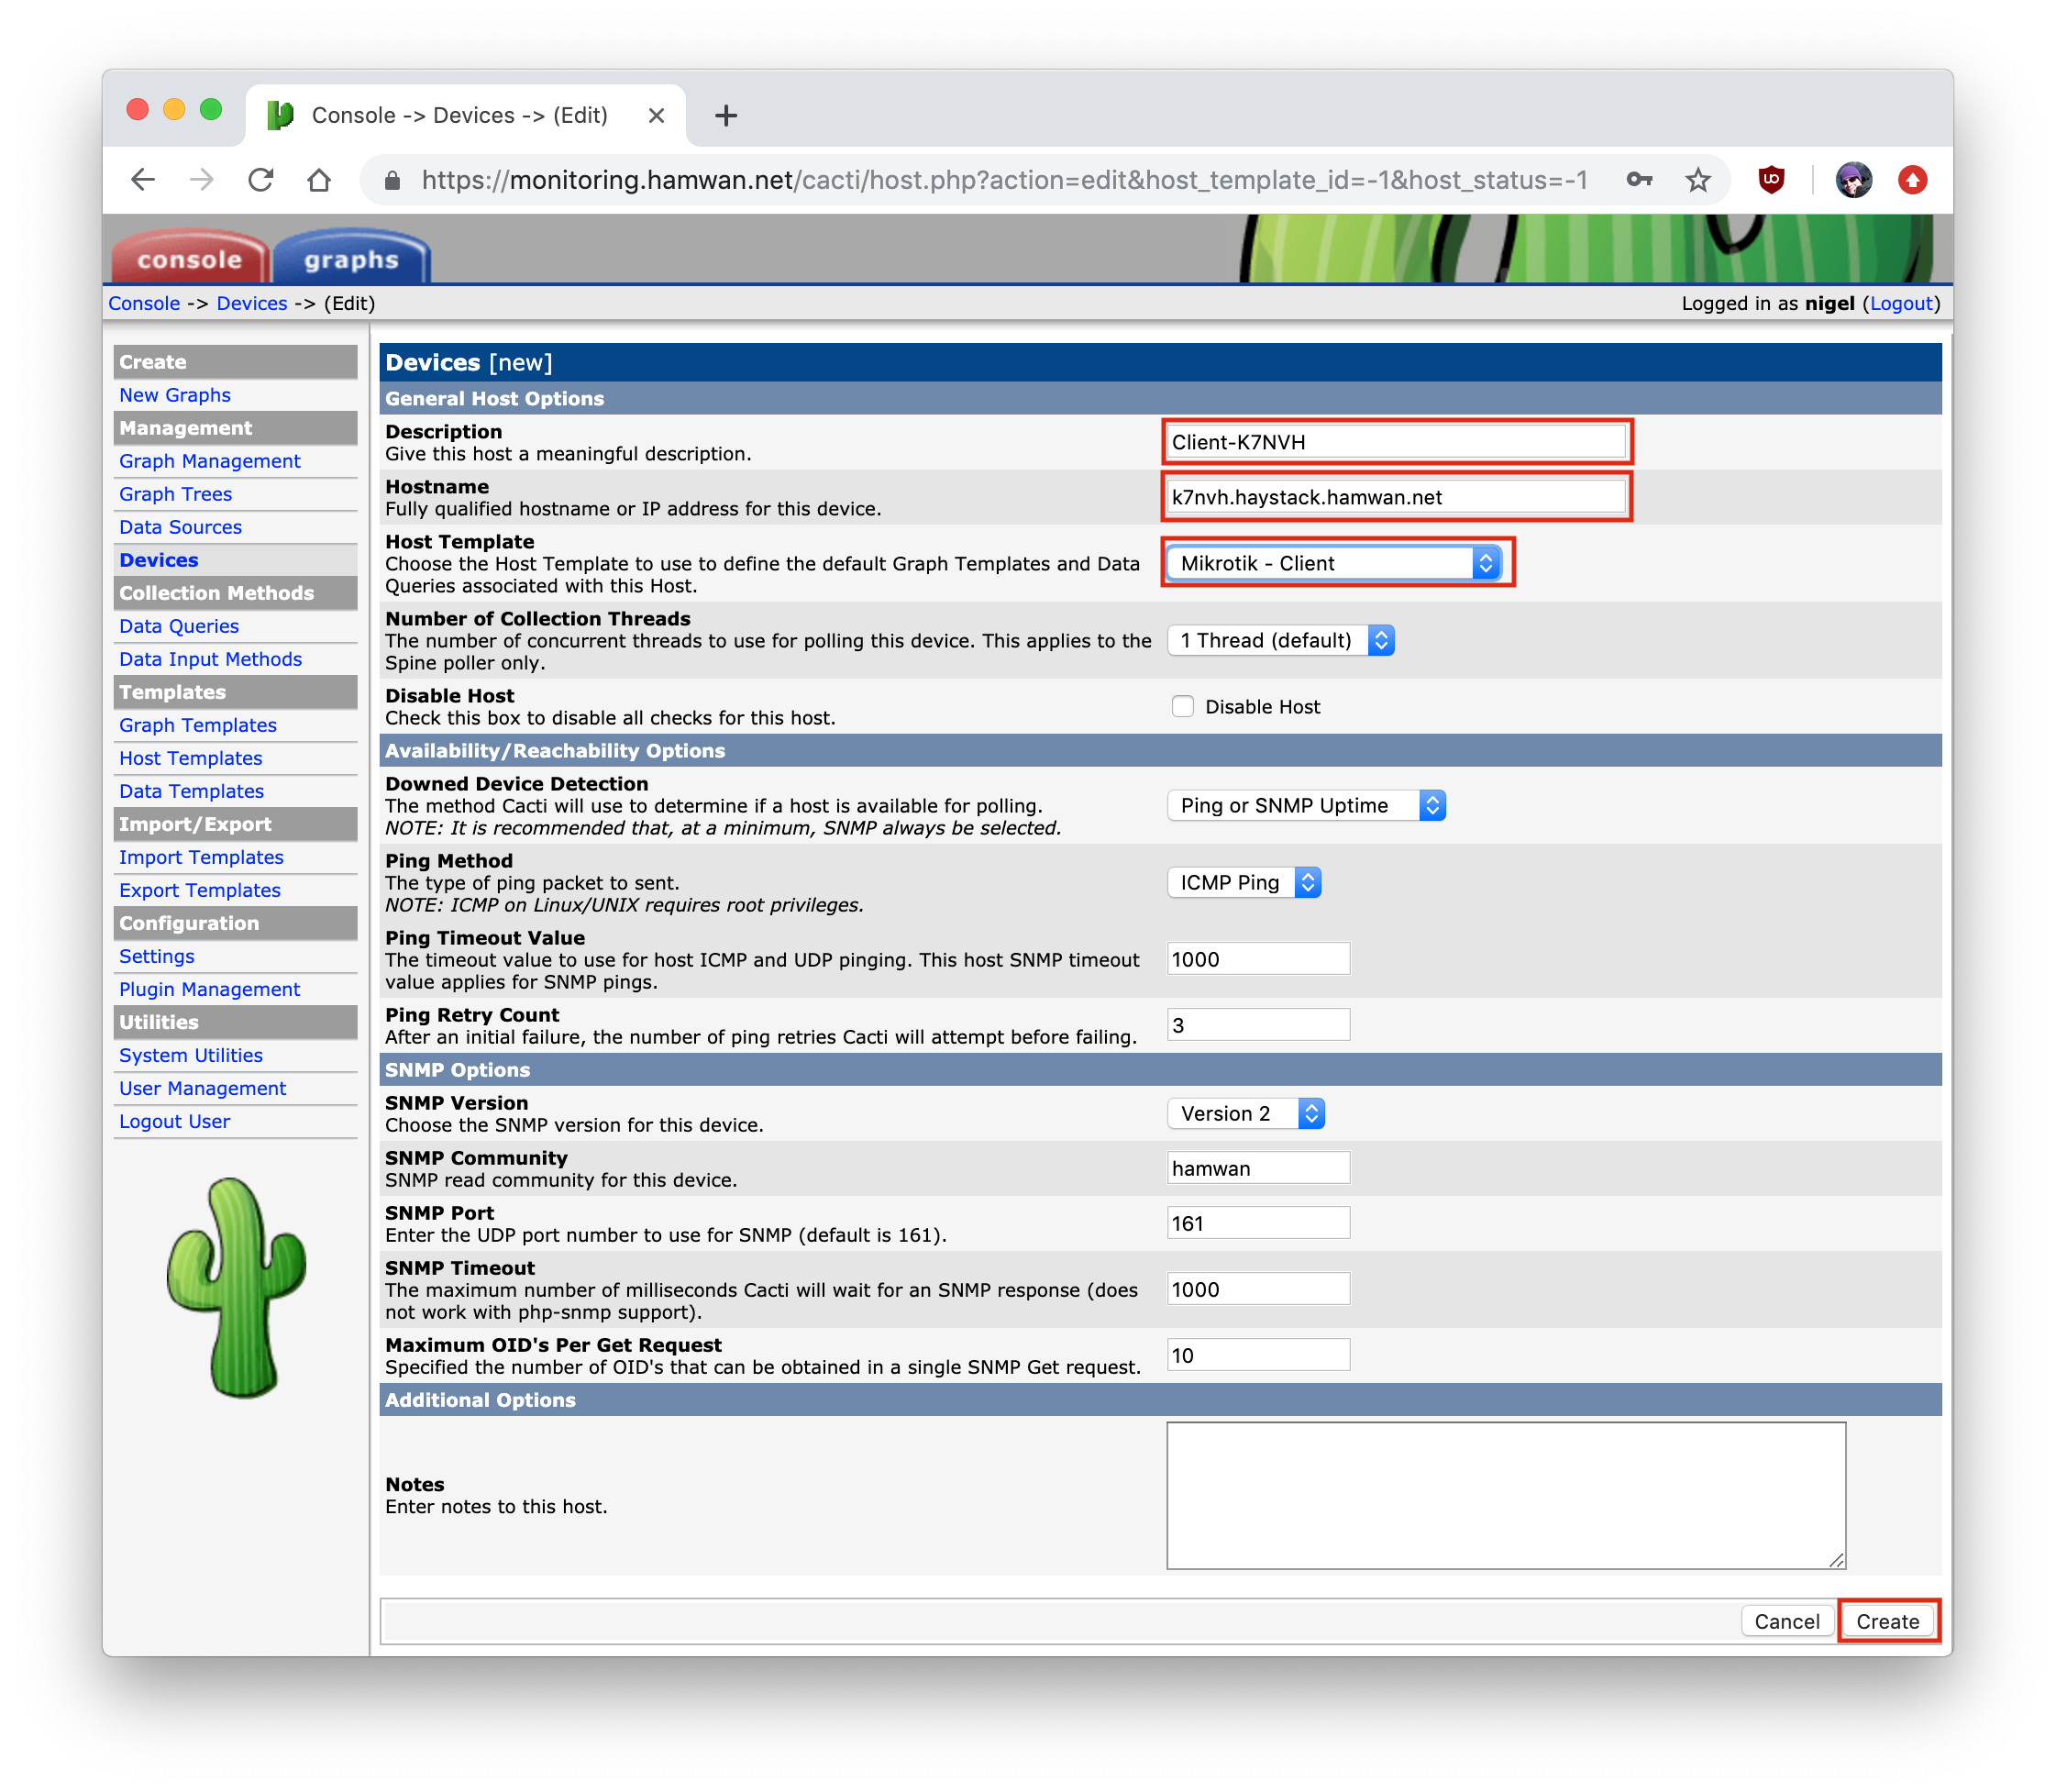
Next you’ll want to give the new device a Description (Typically “Client-
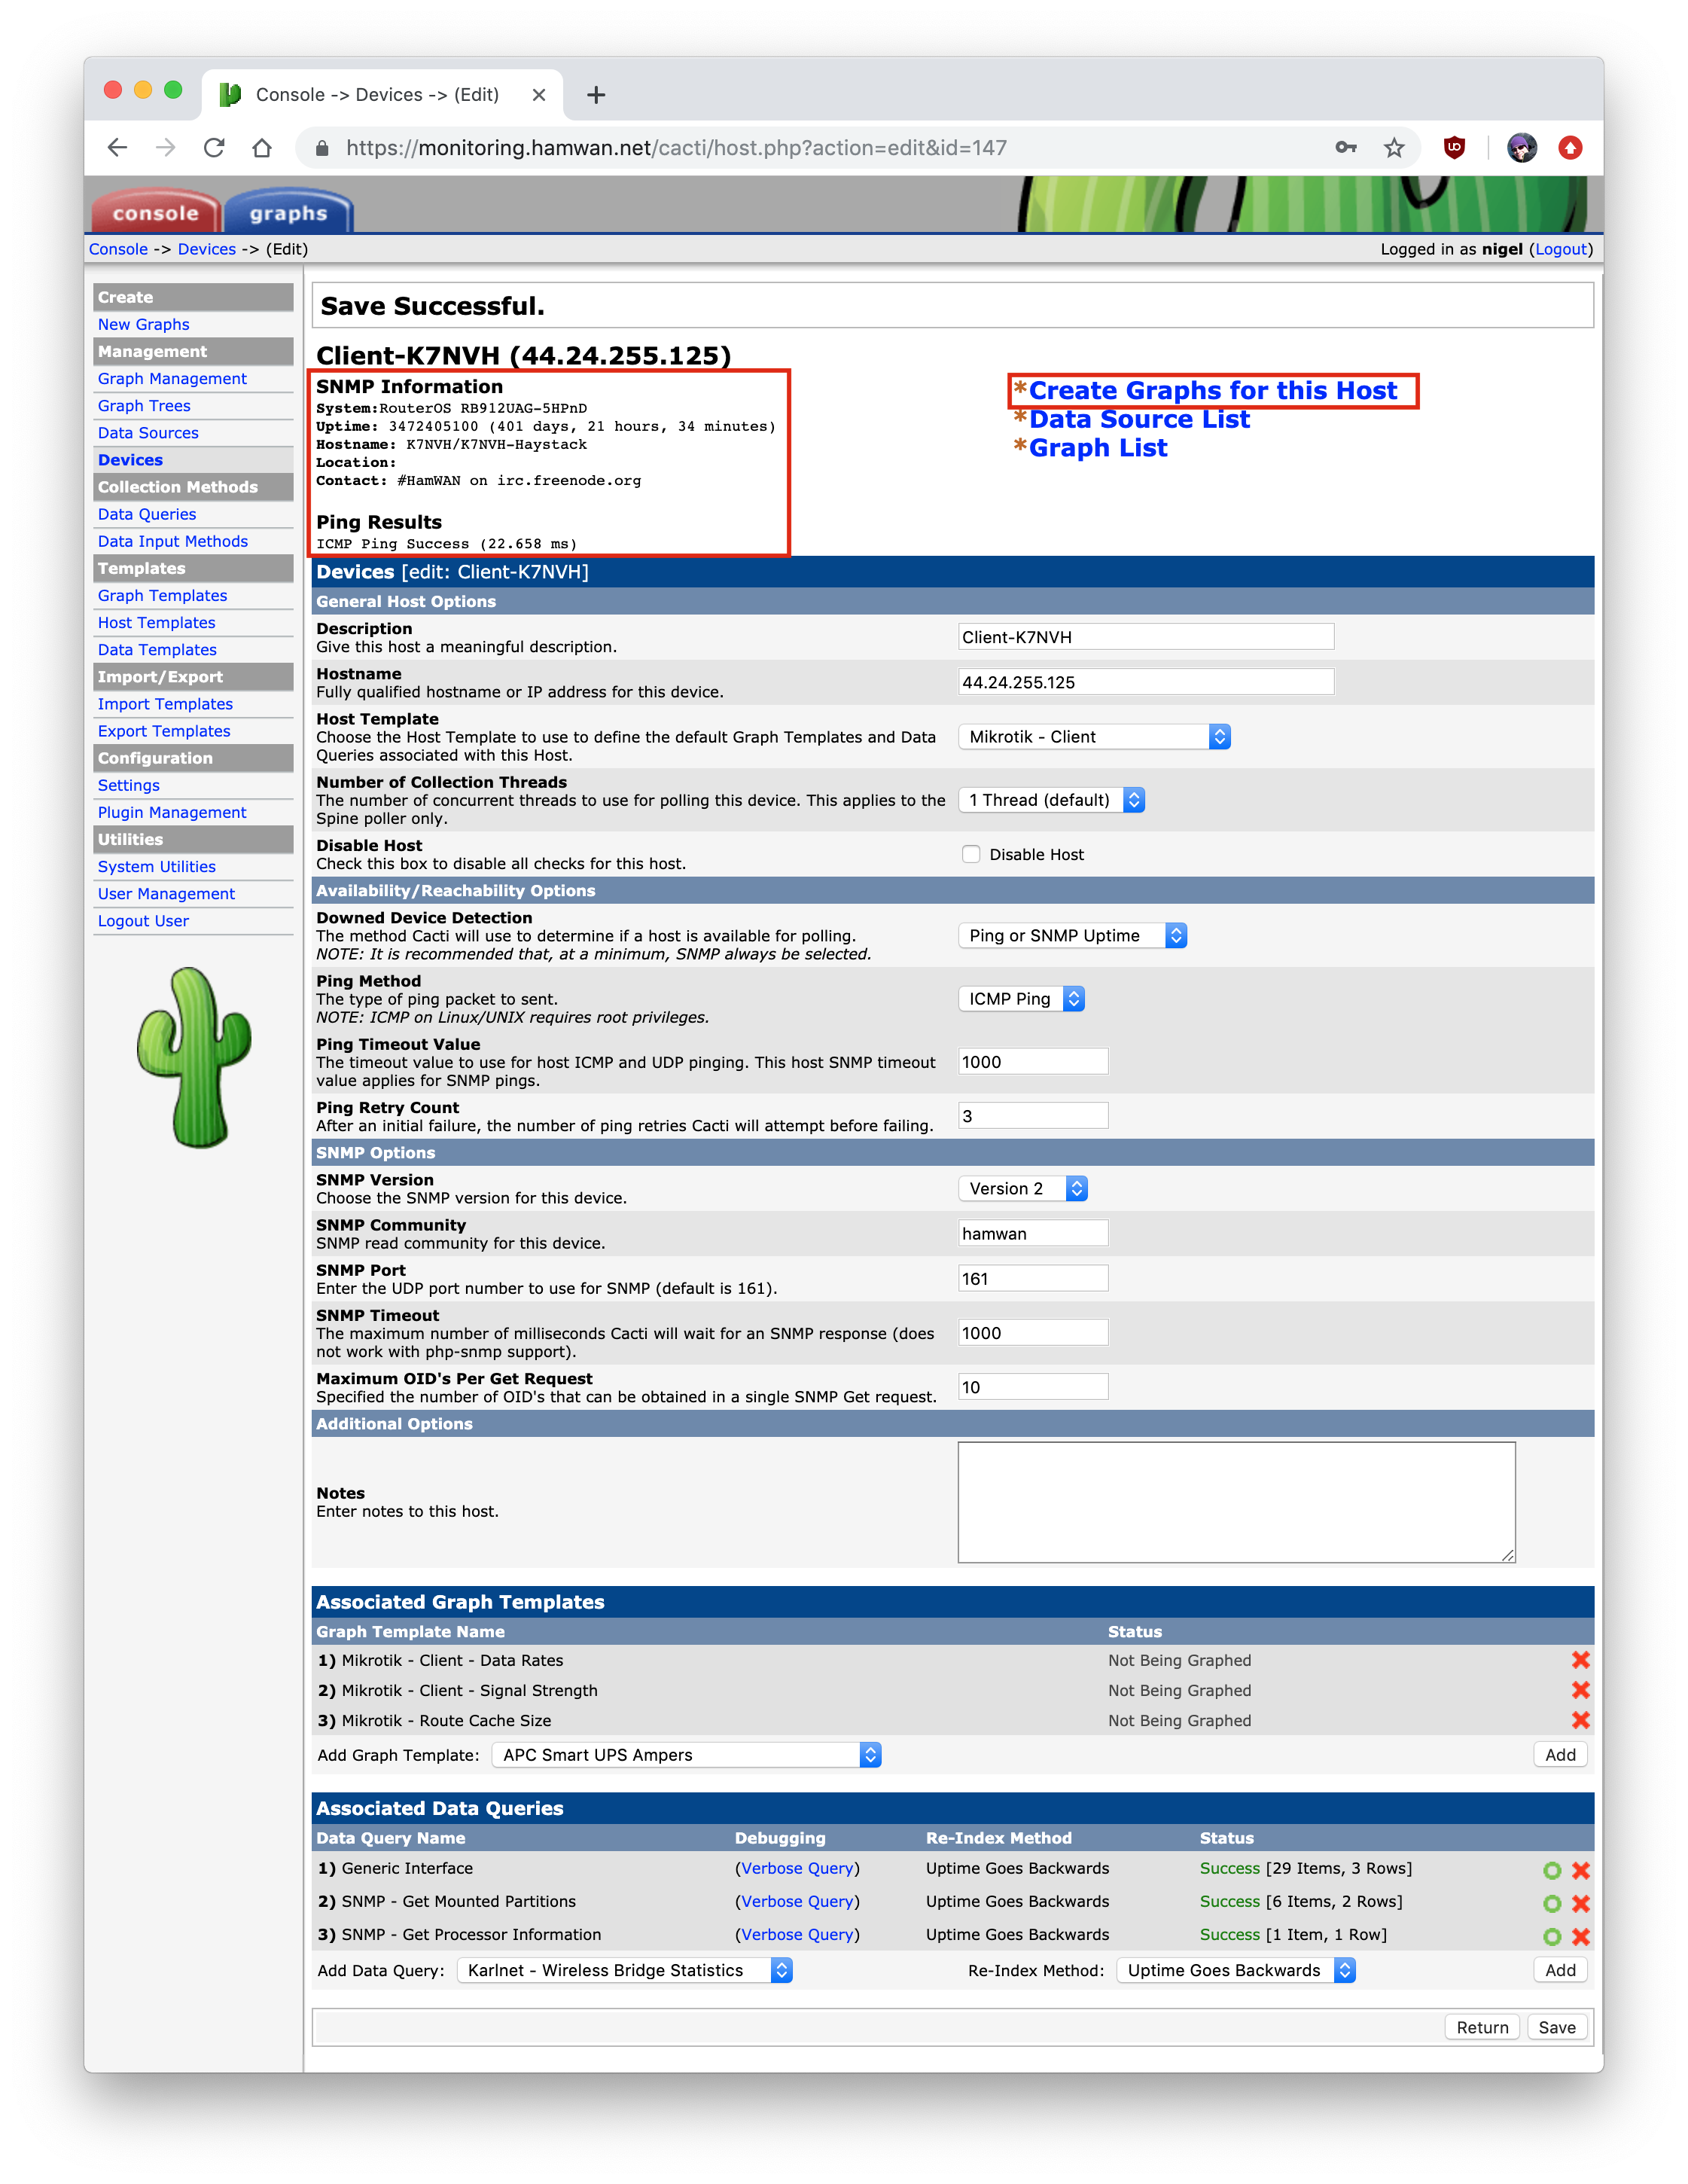
Verify that Cacti is able to reach the device and you see the SNMP information in the upper left. After which, you can now create the graphs for this host.
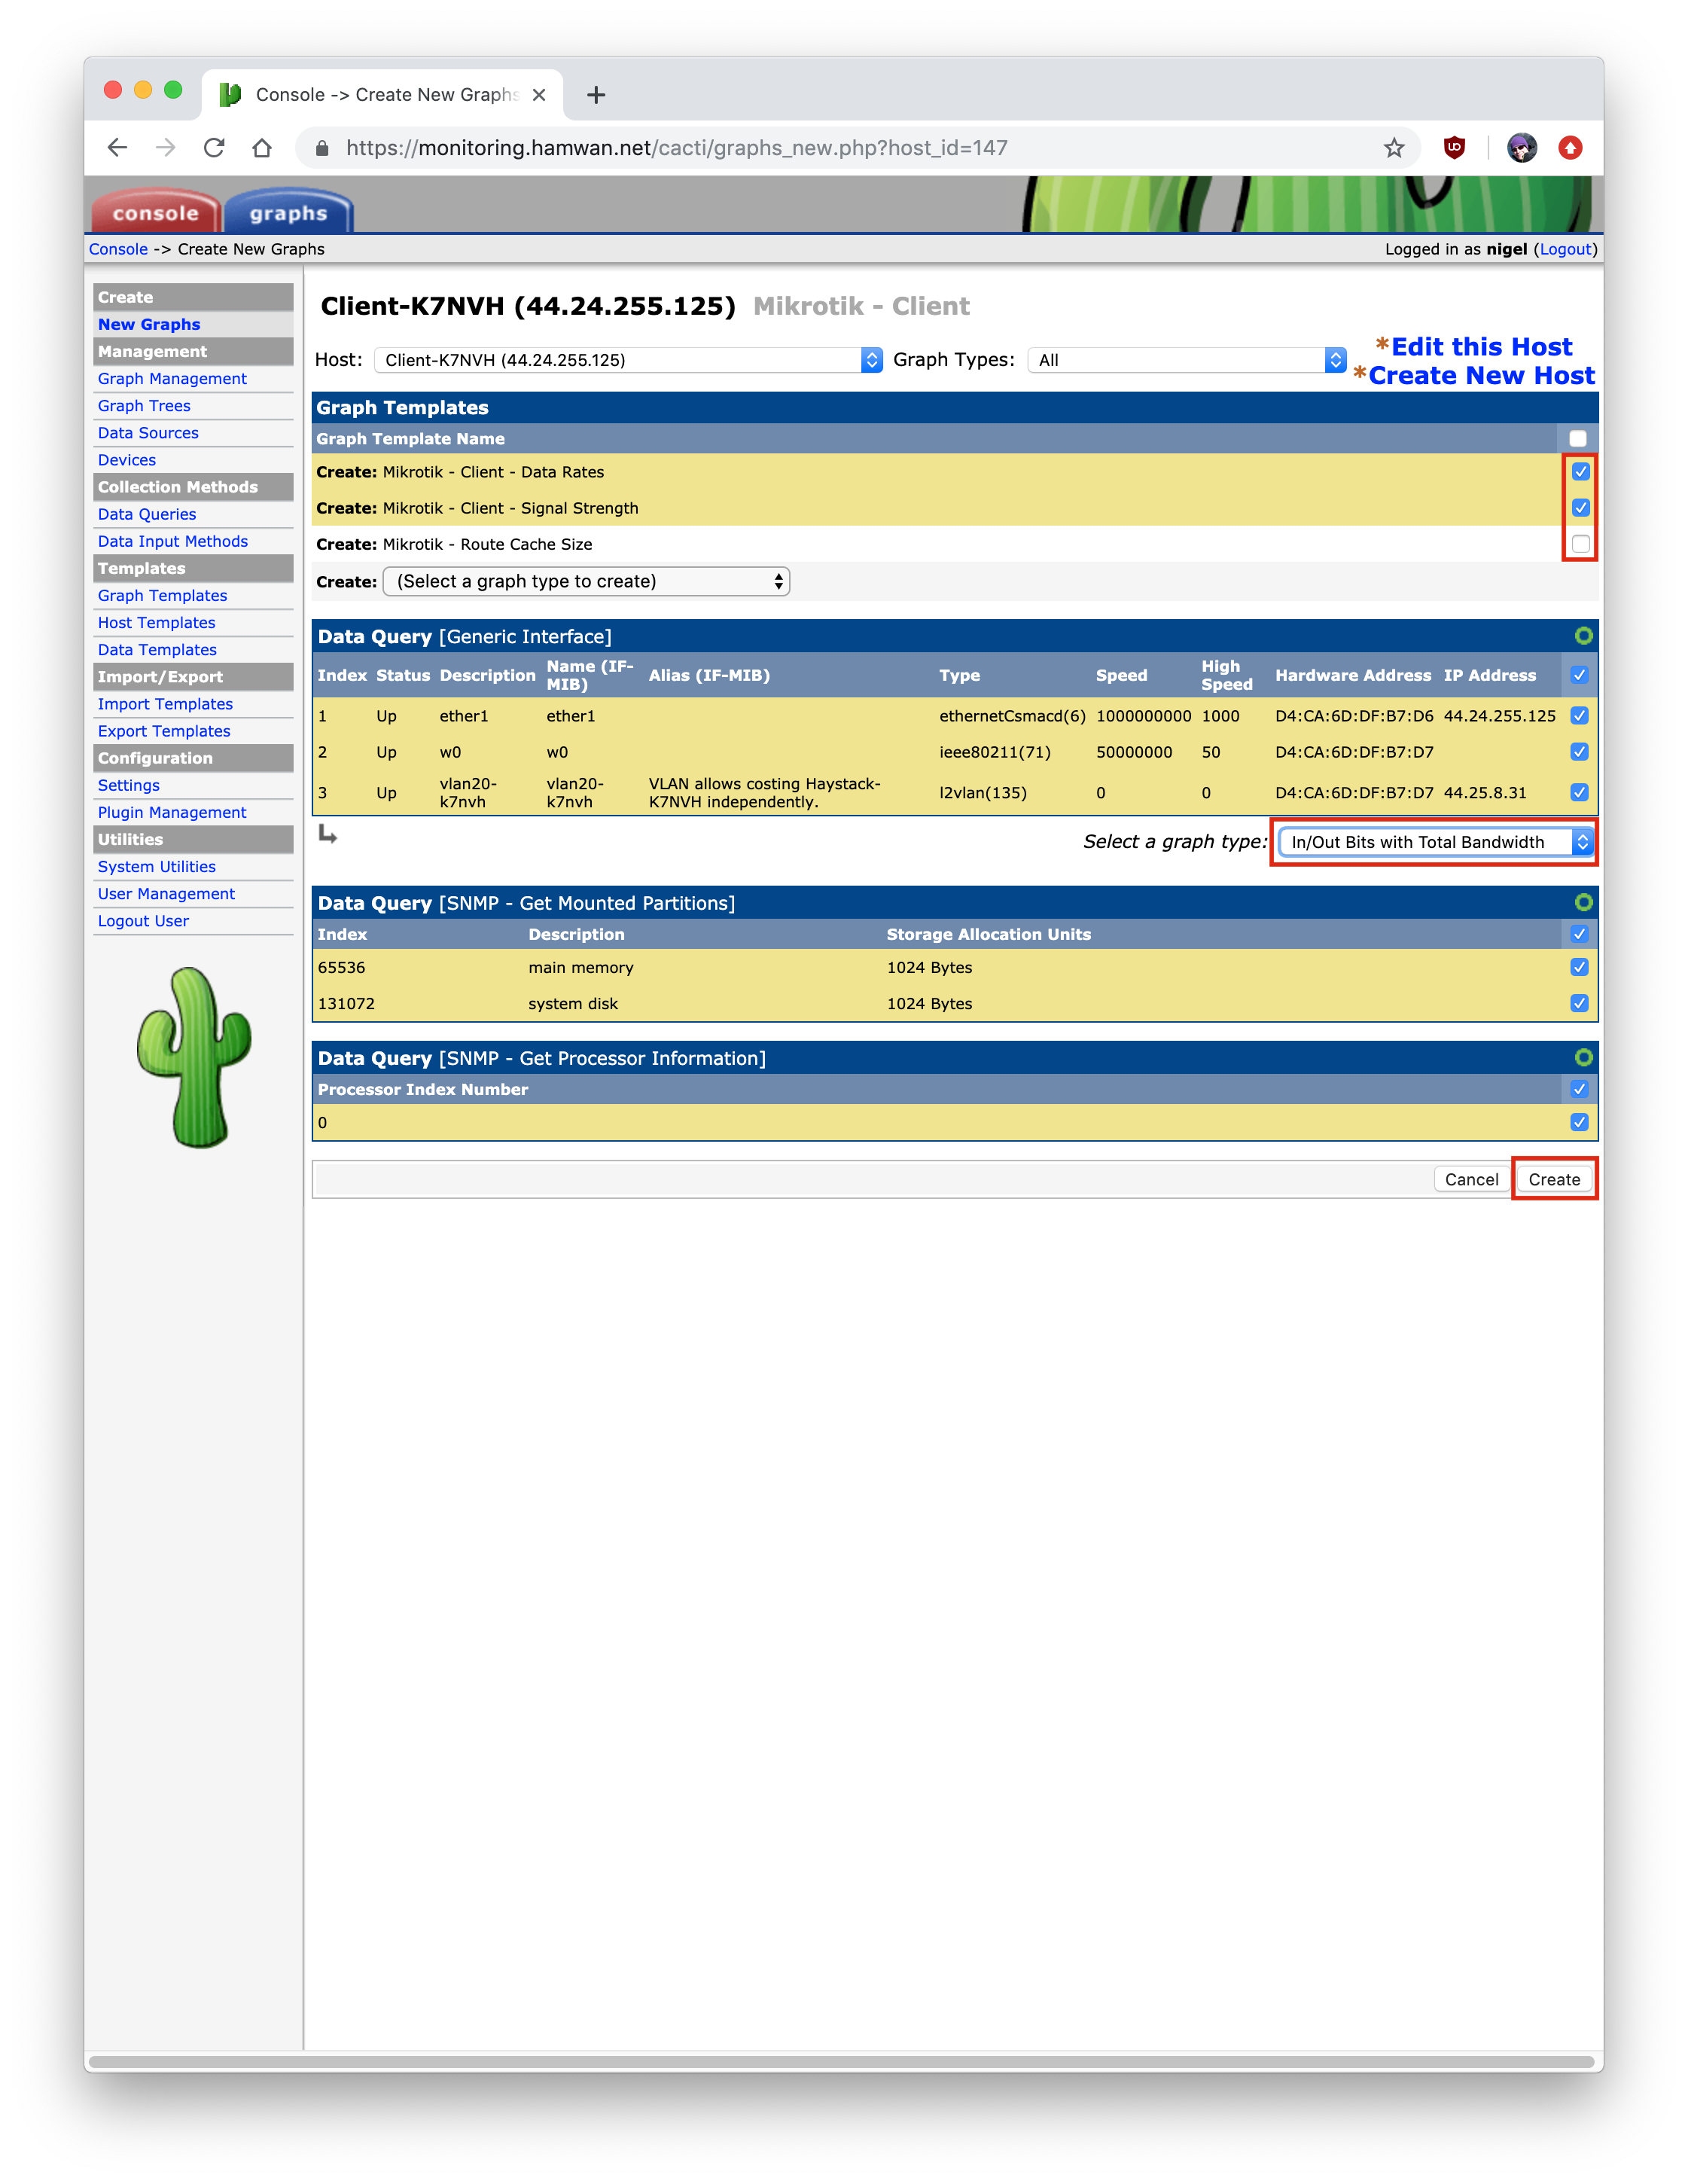
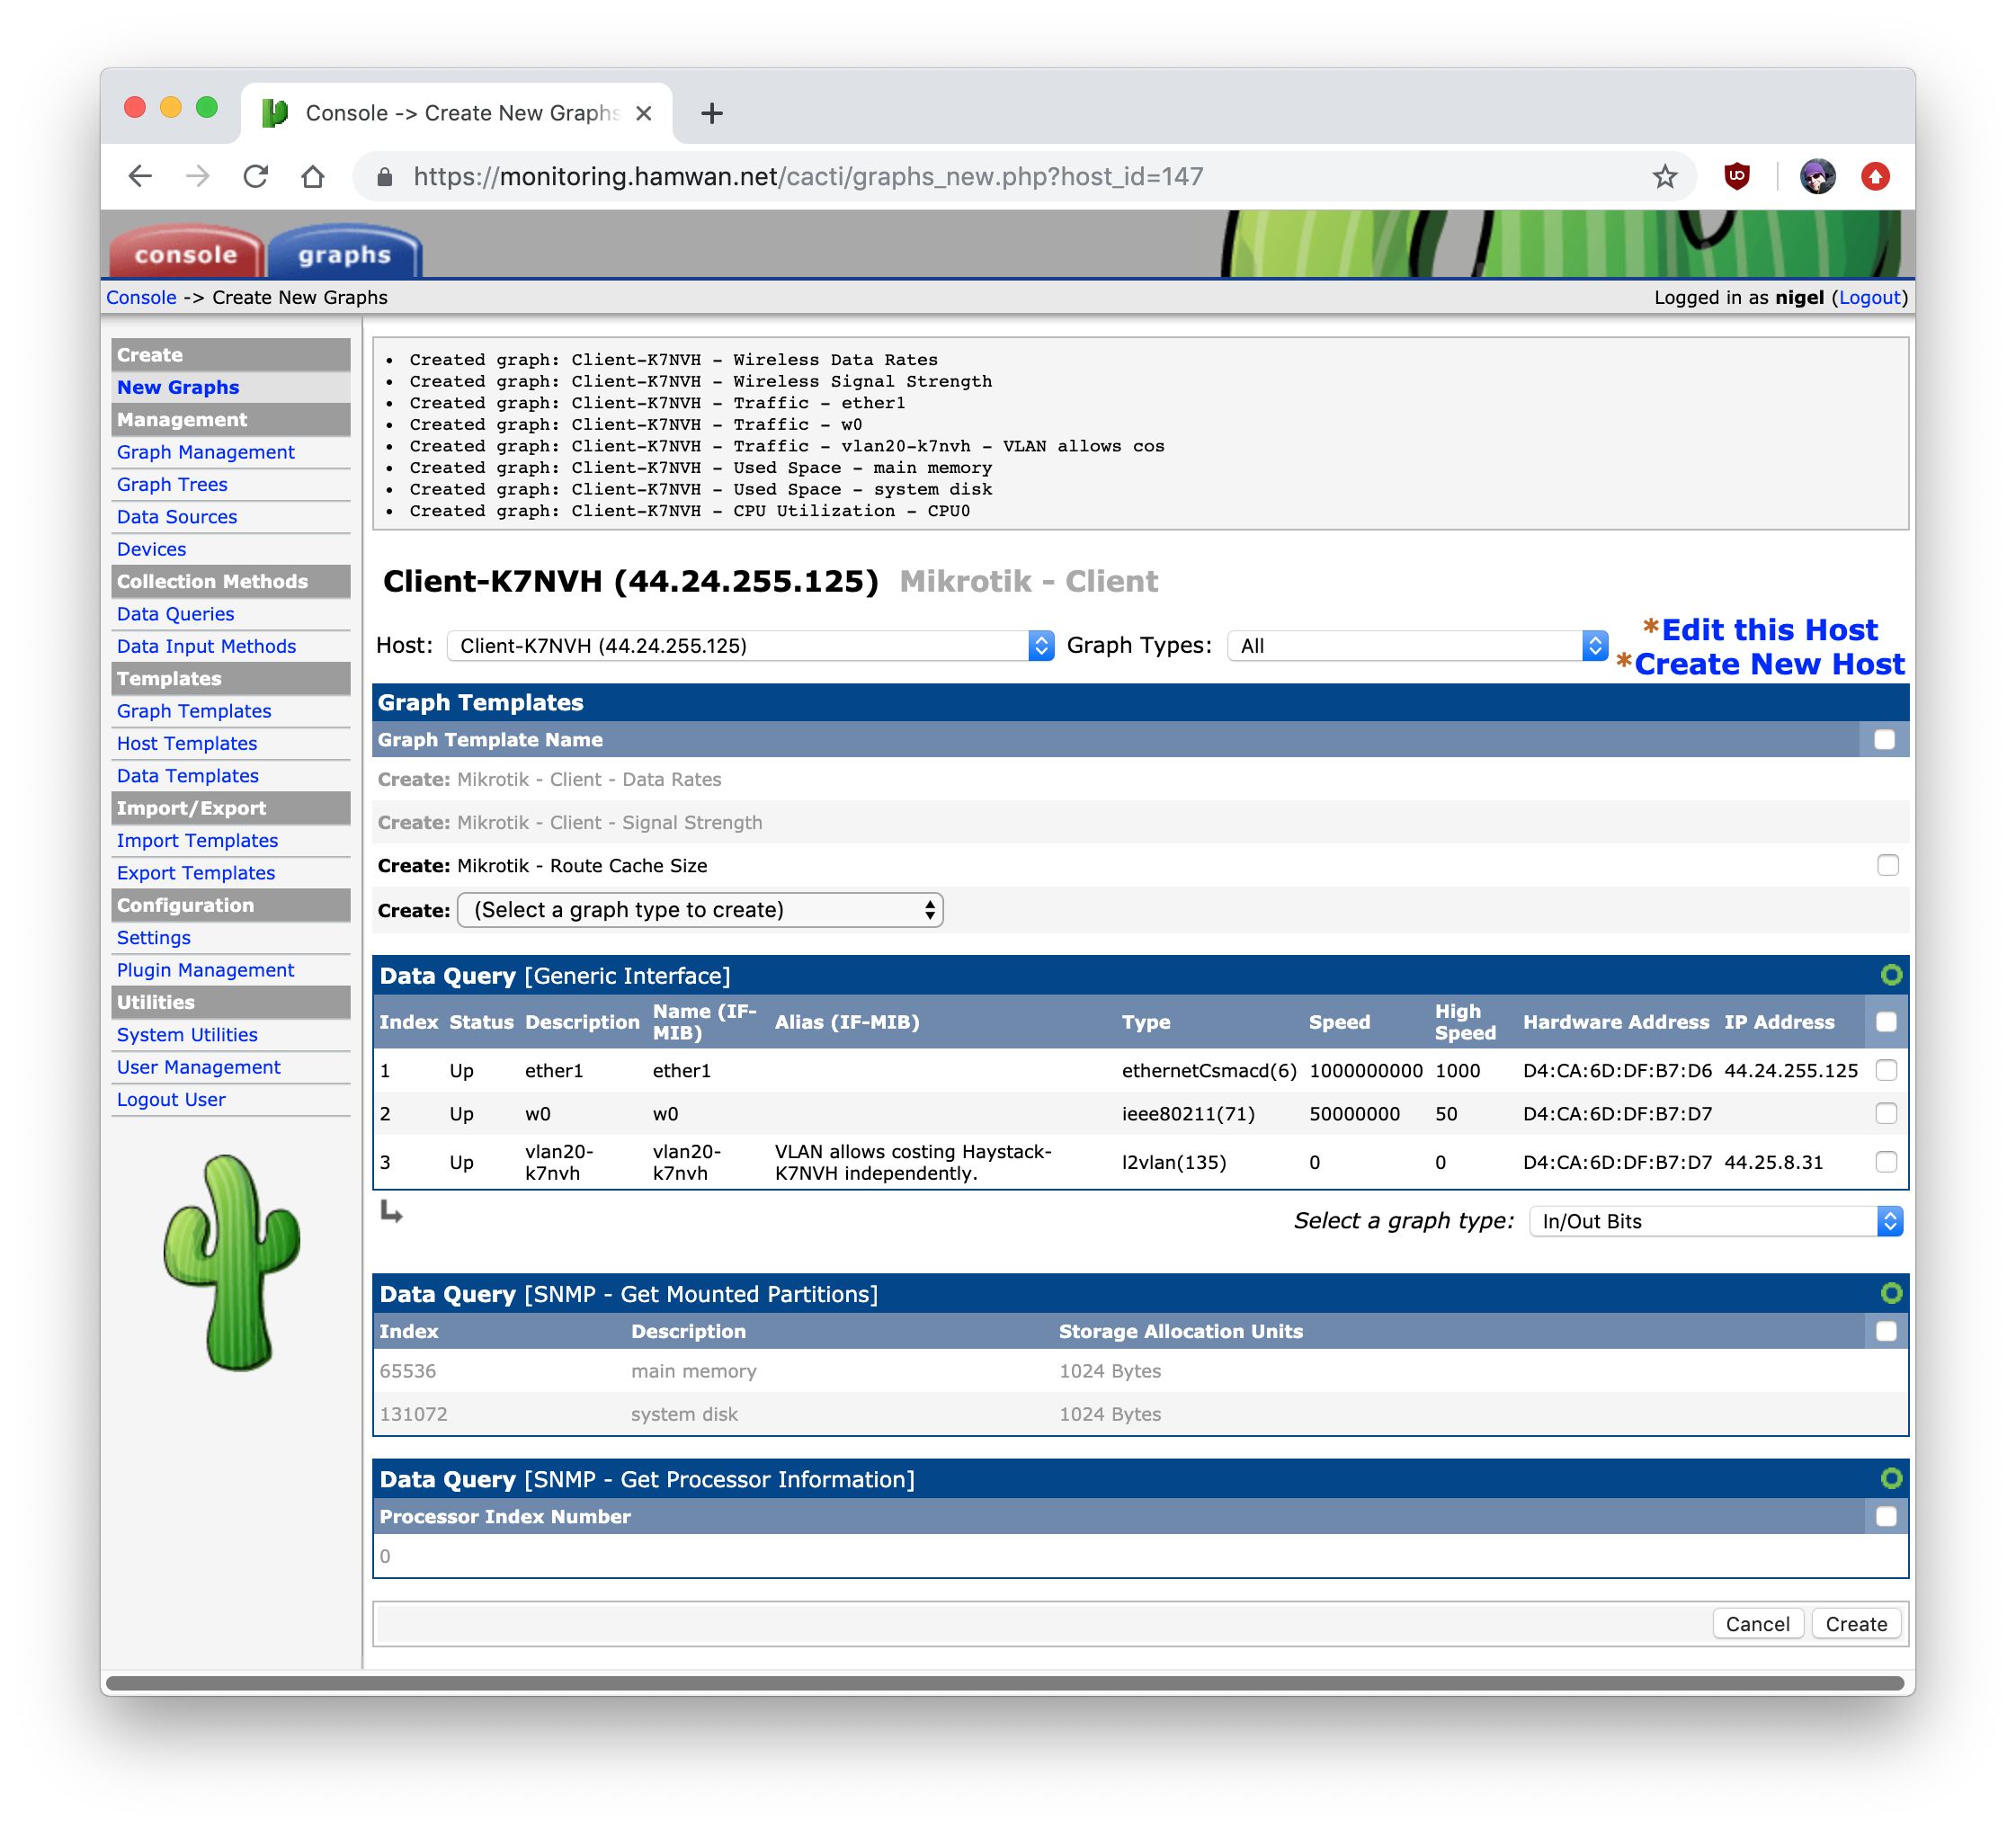
Here you’ll select the graphs to be created. Note that all network interfaces are selected, as well as any partitions and processors. Client data rates and signal strengths are selected, but route cache is not. Route cache data is an option we have used in the past for diagnostics, but is not required.
On the next page, you’ll be given the option to modify the default OIDs used to graph wireless data rates and signal strengths. Often the defaults are fine, but some modems will require changes. This can be done manually later, but if you wish to head it off, you can get the data by logging into the modem and looking at the output of /interface wireless registration-table print oid and using the values reported for tx-rate, rx-rate, and signal-strength.
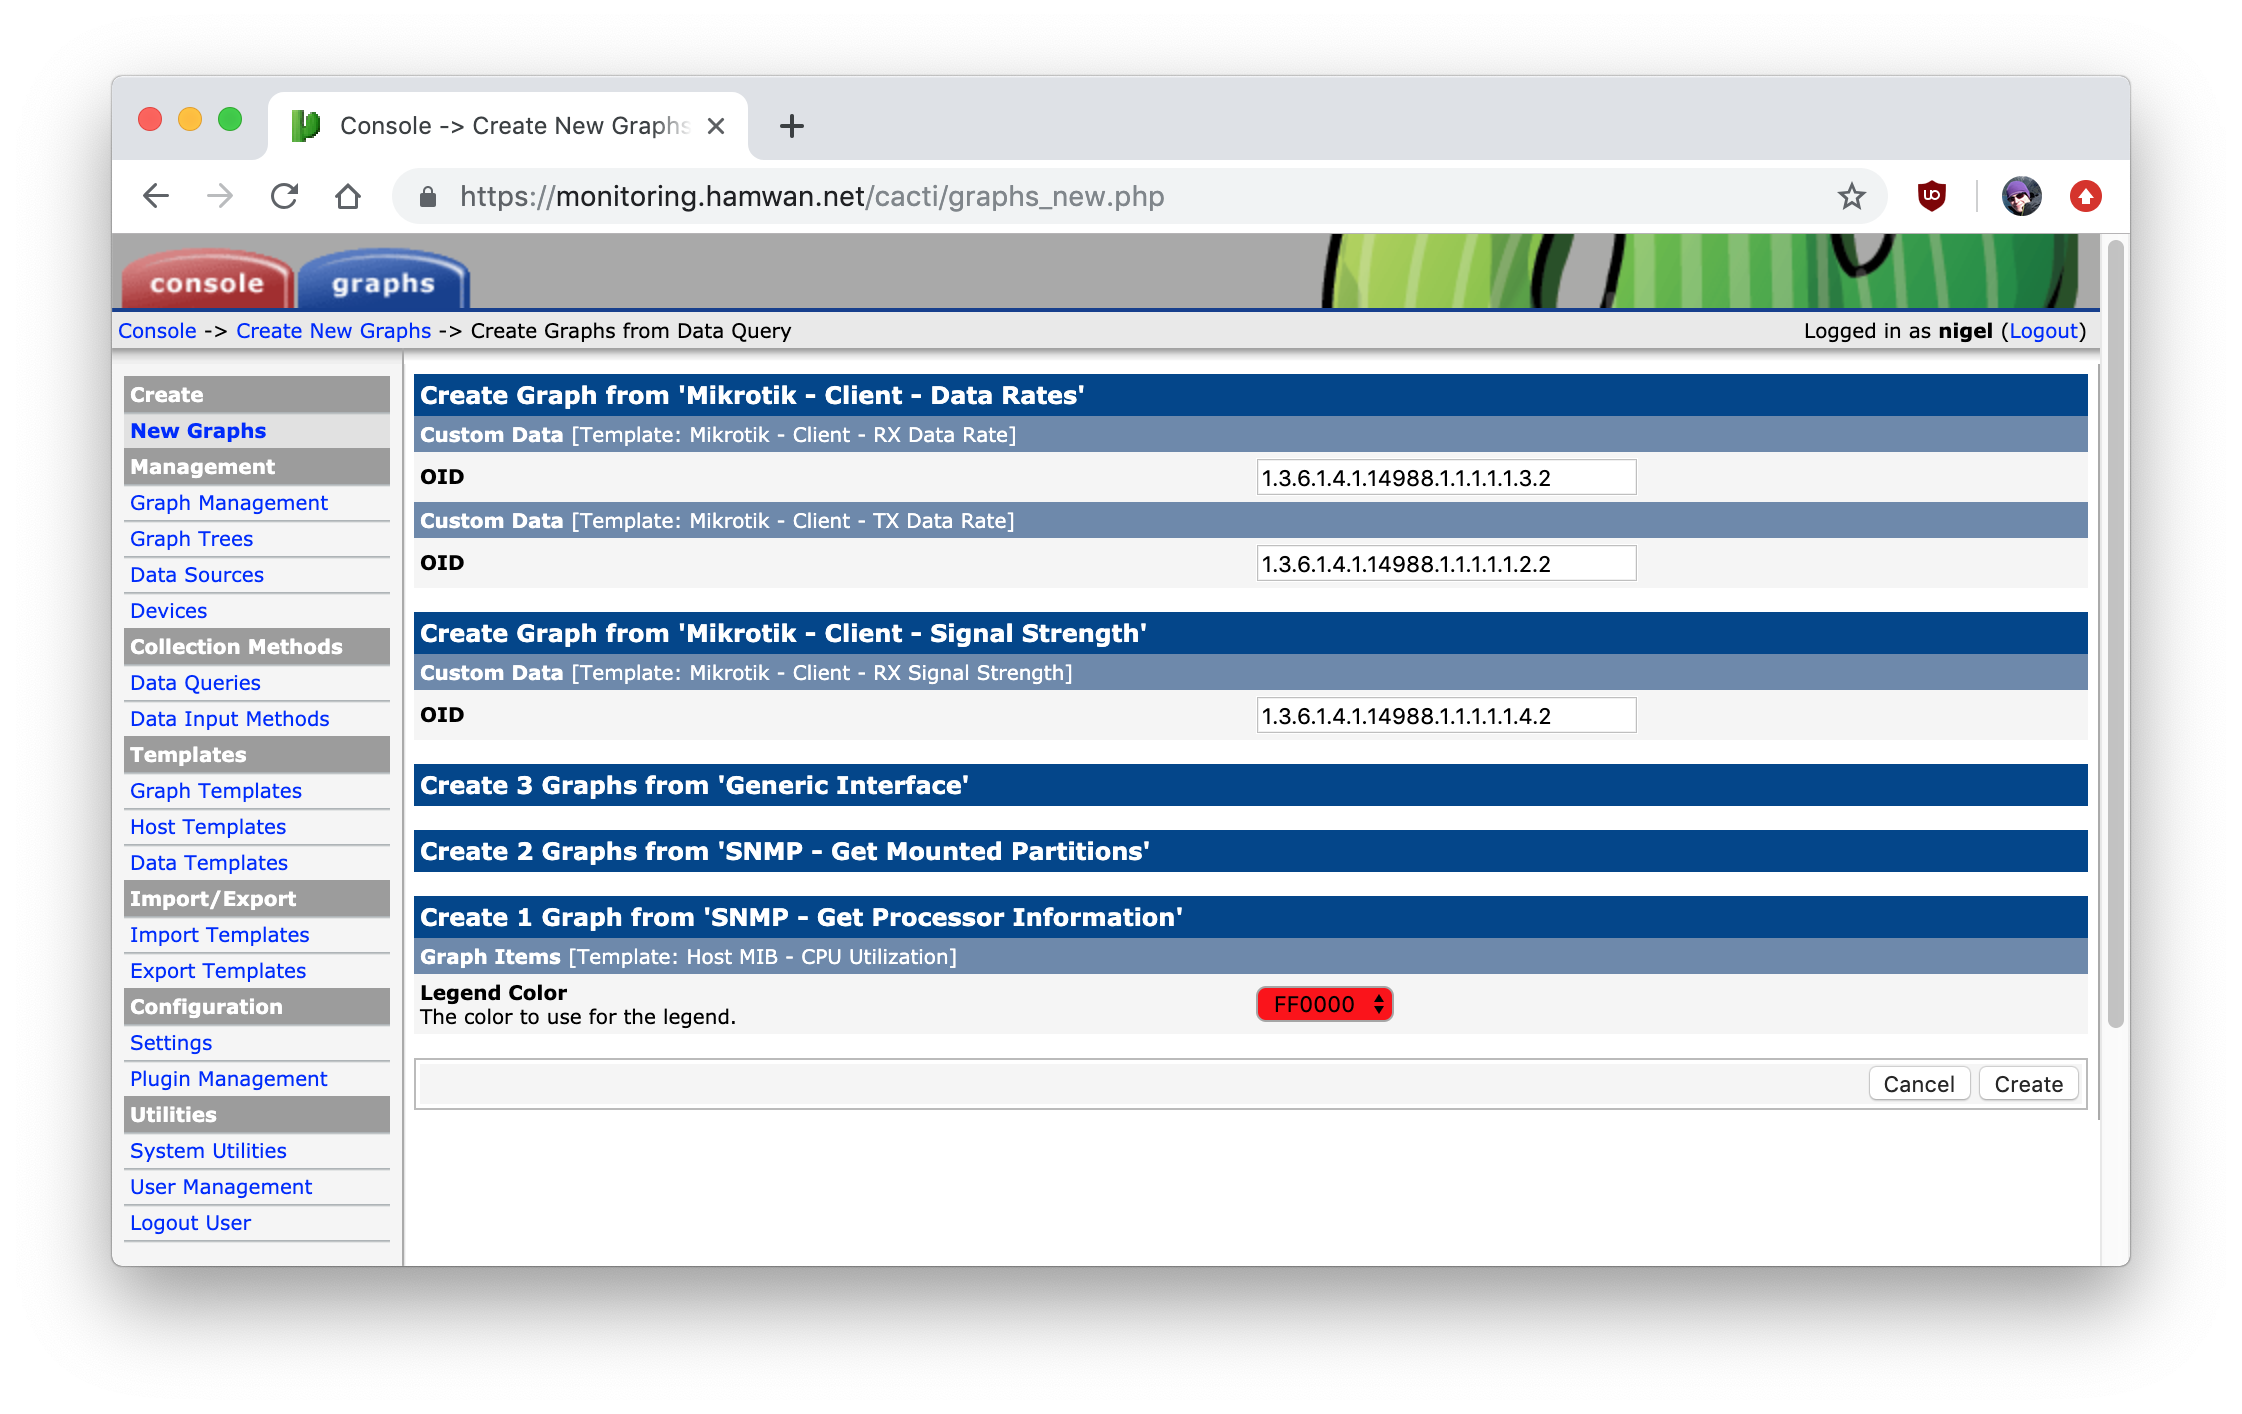
After which, you’ll get a confirmation page that the graphs you selected have been created.
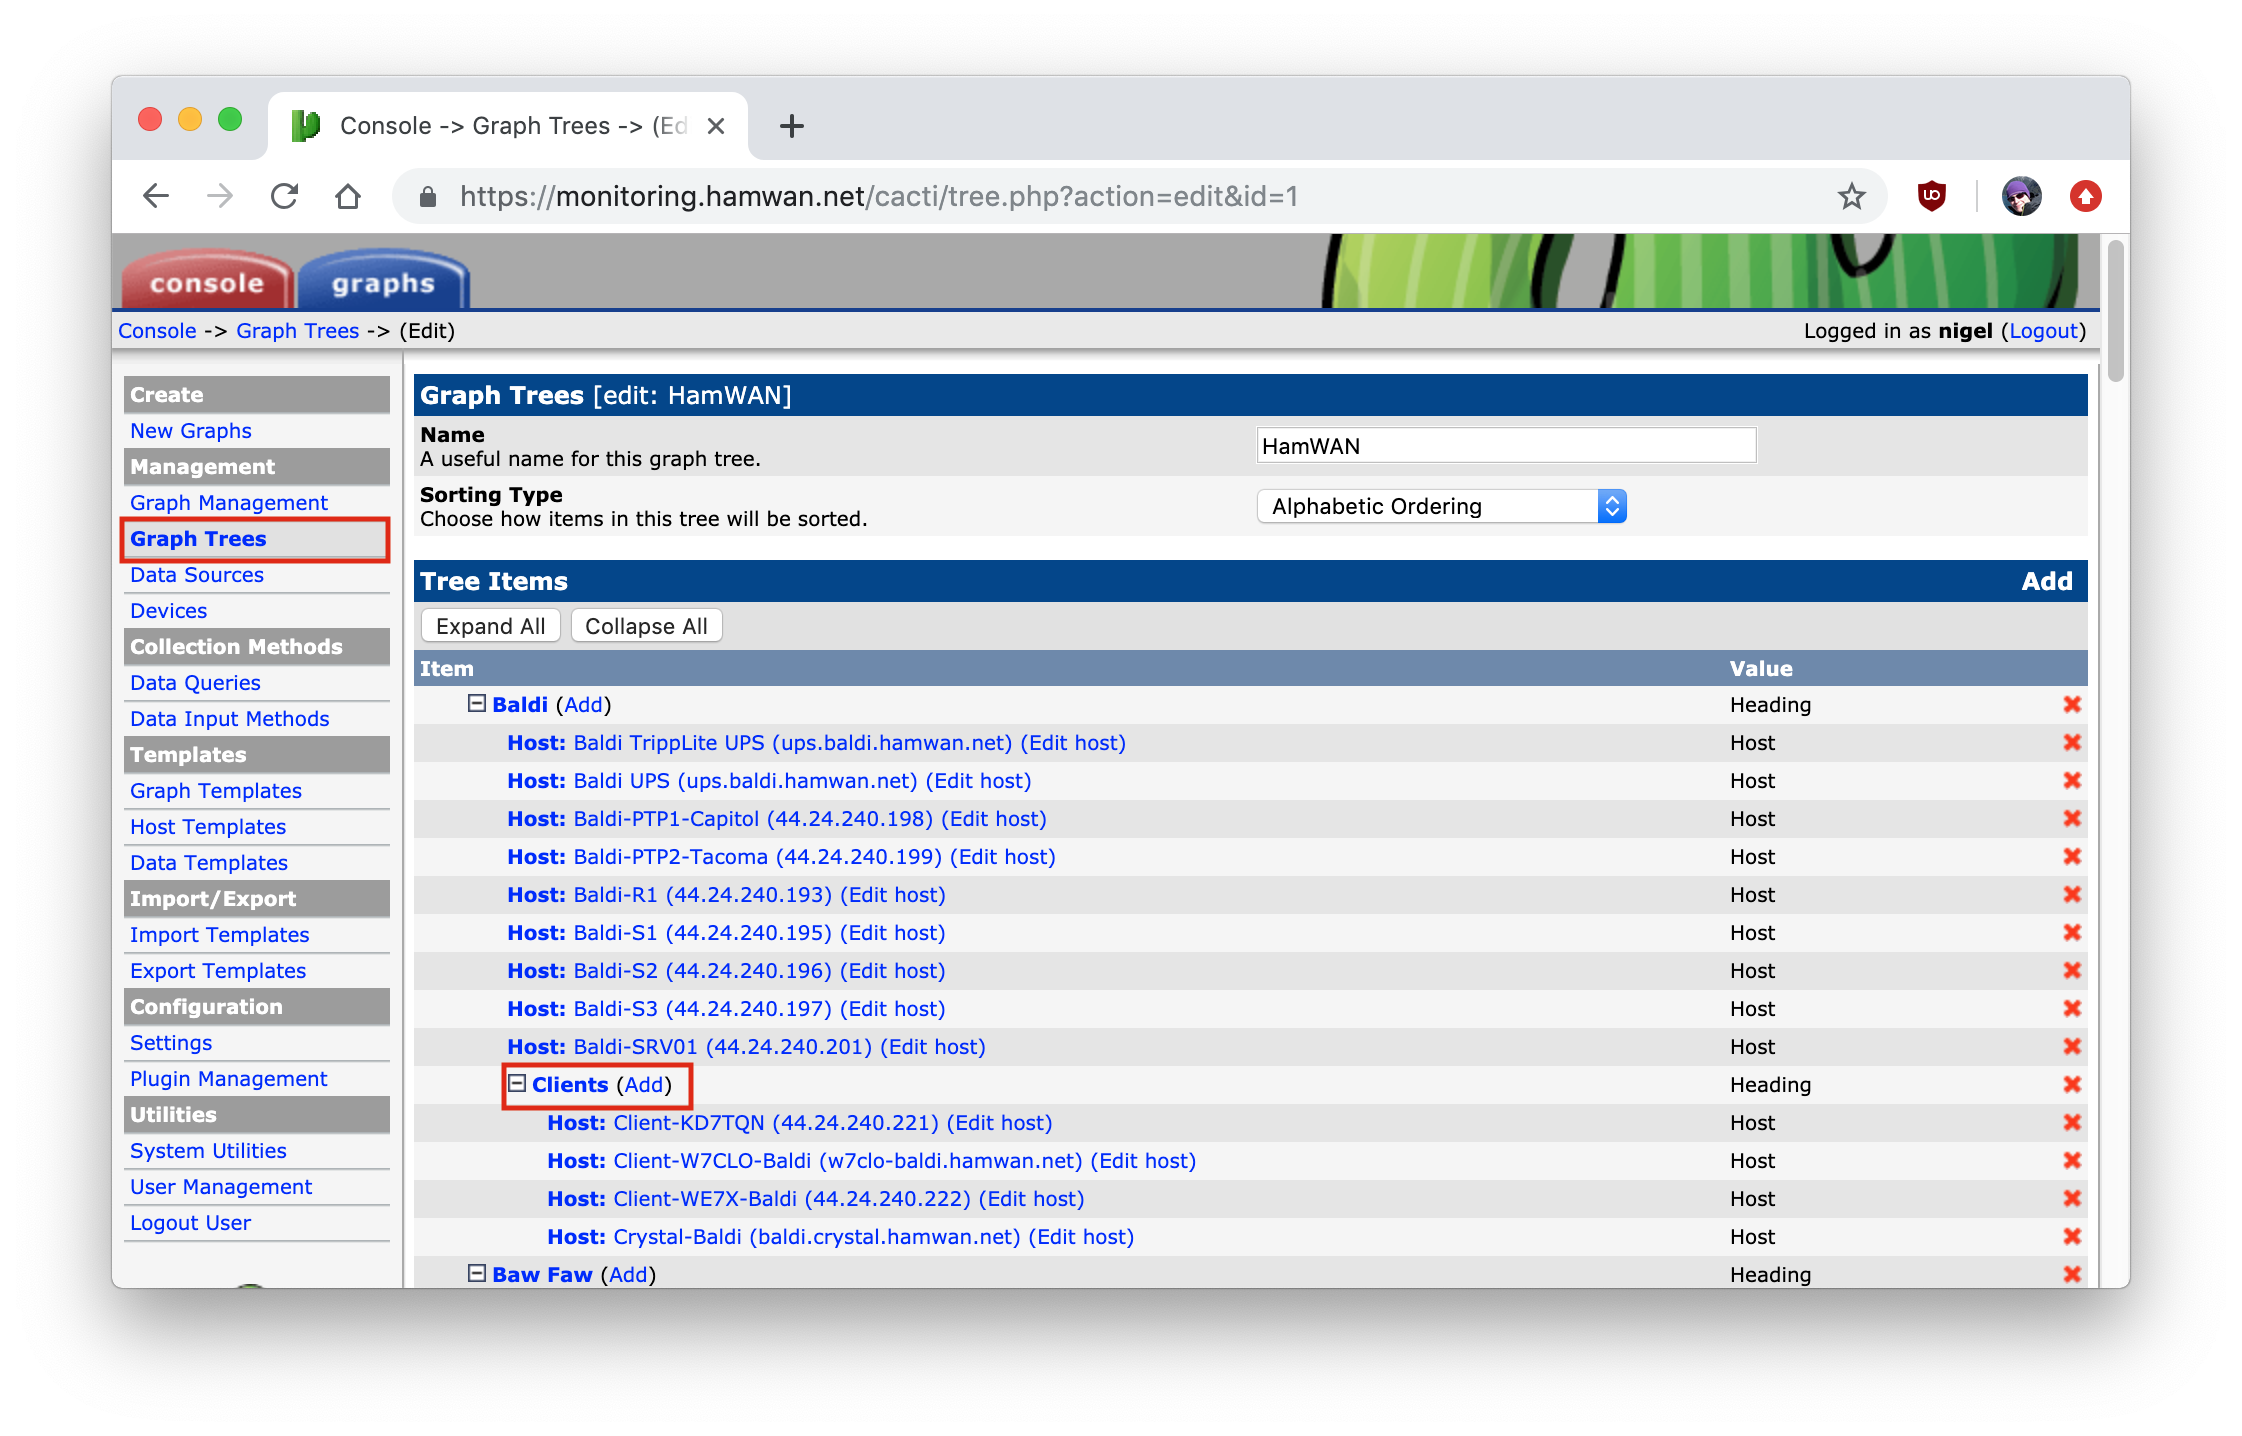
Now you can add the host you’ve just created to the Graph Tree, so it will actually be displayed. Head to the Graph Trees page, and click “Add” on the Clients section of the relevant Site.
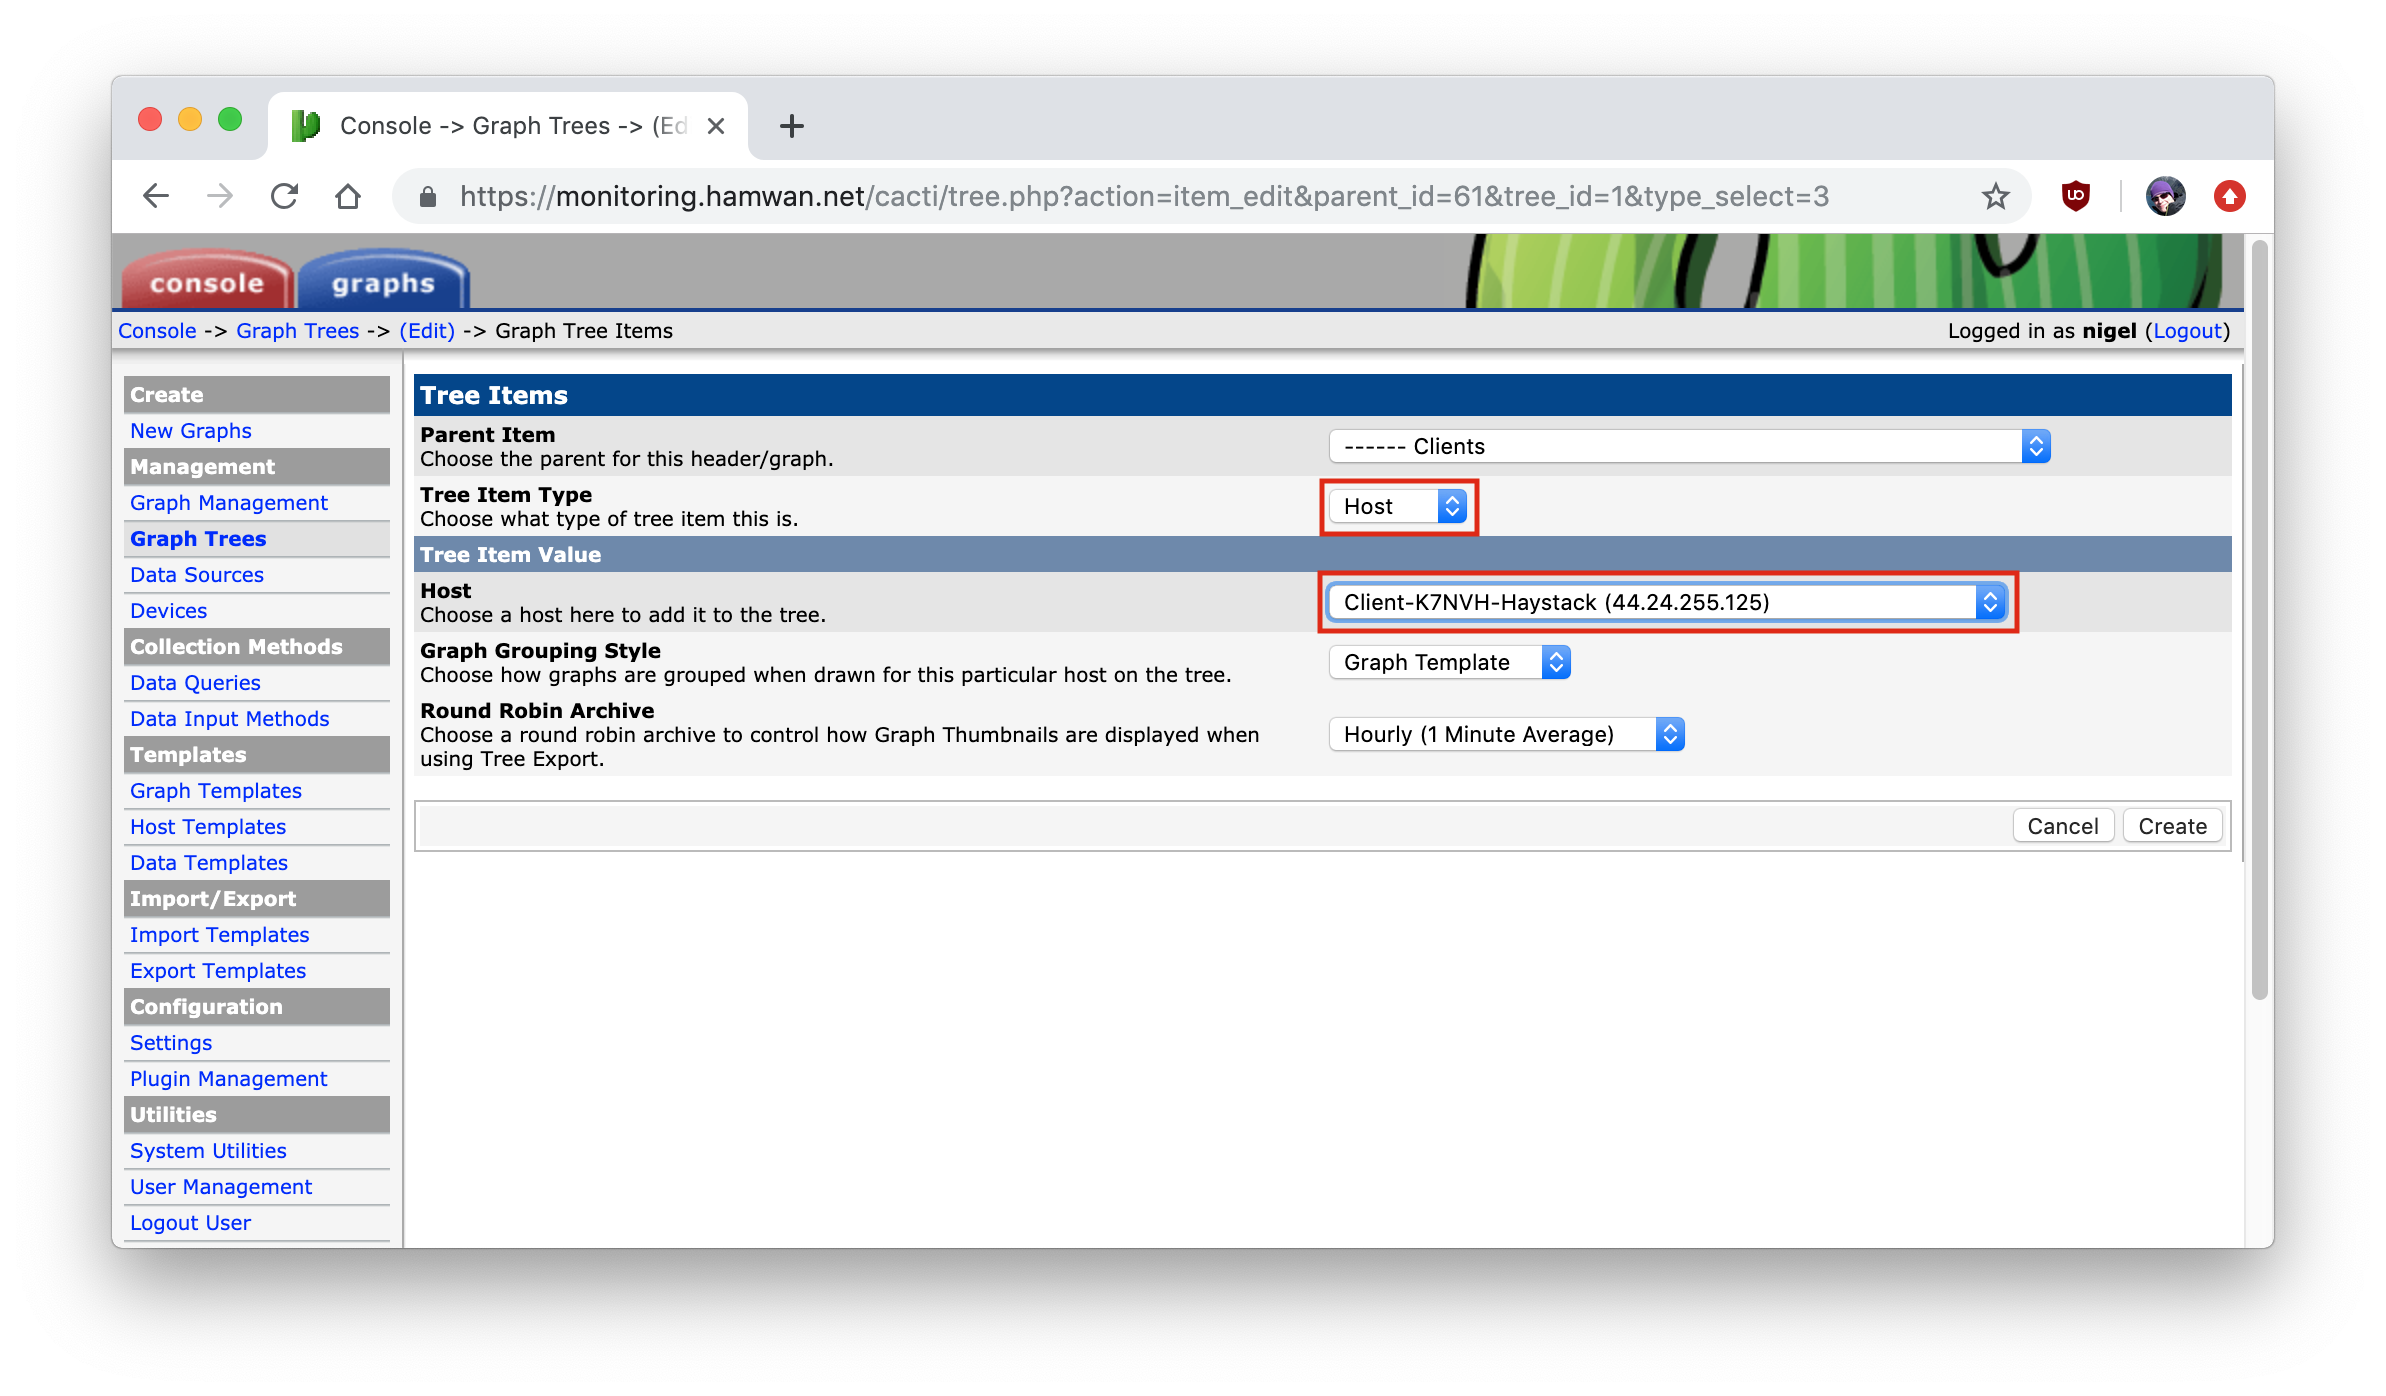
Select the item type as “Host”, and choose the host you’ve just created.
Now you should be able to browse to the Graphs tab and find the host you’ve just added to the tree. Note that it will take some time for the graphs to show up or for them to have valid data. Cacti will actually create the graph files at the next polling cycle (5 minutes), and the graph will only have valid data after a couple of polling cycles, so be patient.
Congrats! You’ve added a host to Cacti monitoring! We’ll cover getting it added to the map on the Map page.
Smokeping
Smokeping provides regular ping / packet loss monitoring, and alerting to the Network Operations mailing list.
Smokeping is available at http://monitoring.hamwan.net/smokeping/
Adding a host to Smokeping
Adding hosts to Smokeping is achieved via adding a handful of lines to the Smokeping configuration file. Typically users are not monitored via Smokeping, only the network infrastructure.
SSH to the monitoring host at monitoring.hamwan.net, and edit the Smokeping targets file located at /etc/smokeping/config.d/Targets with your favorite editor (vi/nano/emacs/etc). Smokeping uses the + headers as it’s tree. A ++ entry will be placed below a + entry.
We have the tree organized as Sites as the root, with the site name, as the branches, and hosts at a site as the leaves. Hopefully looking at the config will make adding new hosts very straightforward.
Once you’re done editing the file and have saved it. Reload the Smokeping service to bring the new file into operation. sudo service smokeping reload.